NAC Secure Horizon
The NAC Secure Horizon annuity is a great safety net for your retirement days. It has beneficial features like value protection and secure income, providing financial stability when needed.
It's easy to understand and straightforward. You'll love its flexibility and control over your retirement saving. A smart choice indeed for a worry-free future!
NAC Secure Horizon
About Product
Performance Strategy Ladder
The Term Point-to-Point Participation Rate Strategy Ladder (or Strategy Ladder) and Term Point-to-Point Participation Rate Strategy Ladder with Strategy Charge (or Strategy Ladder with Strategy Charge) methods allocate your premium equally across five index account Strategies with different term lengths. This combination of term lengths is designed to take advantage of higher participation rates generally associated with longer terms. Because at least one strategy’s term will end each Contract year, the Strategy Ladder and Strategy Ladder with Strategy Charge also provide the potential for interest credits each year.
At the end of each Strategy or sub-allocation’s term length, the accumulation value allocated to that sub-allocation may receive interest credits and will then automatically transfer to a new Strategy with a new term length and participation rates that will be declared at that time. The Strategy Ladder and Strategy Ladder with Strategy Charge will end at the end of the 10th Contract year and all funds will then be allocated to a Two-year Point-to-Point with Participation Rate or Two-year Point-to-Point with Participation Rate and Strategy Charge respectively unless you instruct otherwise.
You may only allocate premium to the Strategy Ladder and Strategy Ladder with Strategy Charge on the Contract’s issue date.
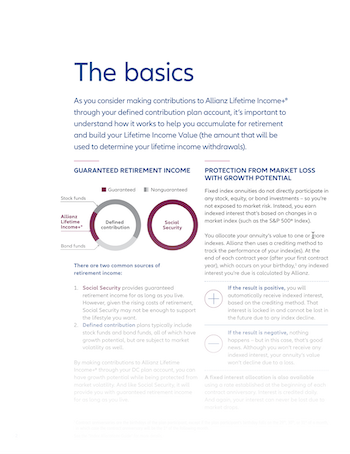
Allocation Accounts
| Name | Type | Rates |
|---|---|---|
| 5-Year Term Loomis Sayles Managed Futures PTP Participation Rate (OR Only) |
Performance Ladder
5-Year
|
435%
Participation
|
| 4-Year Term Loomis Sayles Managed Futures PTP Participation Rate (OR Only) |
Performance Ladder
4-Year
|
365%
Participation
|
| 3-Year Term Loomis Sayles Managed Futures PTP Participation Rate (OR Only) |
Performance Ladder
Triennial
|
320%
Participation
|
| 2-Year Term Loomis Sayles Managed Futures PTP Participation Rate (OR Only) |
Performance Ladder
Biennial
|
250%
Participation
|
| 1-Year Term Loomis Sayles Managed Futures PTP Participation Rate (OR Only) |
Performance Ladder
Annual
|
180%
Participation
|
| 5-Year Term Loomis Sayles Managed Futures PTP Participation Rate (OR Only) with Charge |
Performance Ladder
5-Year
|
485%
Participation
|
| 4-Year Term Loomis Sayles Managed Futures PTP Participation Rate (OR Only) with Charge |
Performance Ladder
4-Year
|
440%
Participation
|
| 3-Year Term Loomis Sayles Managed Futures PTP Participation Rate (OR Only) with Charge |
Performance Ladder
Triennial
|
390%
Participation
|
| 2-Year Term Loomis Sayles Managed Futures PTP Participation Rate (OR Only) with Charge |
Performance Ladder
Biennial
|
300%
Participation
|
| 1-Year Term Loomis Sayles Managed Futures PTP Participation Rate (OR Only) with Charge |
Performance Ladder
Annual
|
220%
Participation
|
| 1-Year Fixed Account |
Fixed
|
4.25%
Fixed
|
| 1-Year Loomis Sayles Managed Futures 2 PTP Participation Rate with Charge |
Point to Point
Annual
|
220%
Participation
|
| 1-Year Loomis Sayles Managed Futures 2 PTP Participation Rate |
Point to Point
Annual
|
180%
Participation
|
| 1-Year S&P 500 LV DRC 5% ER PTP Participation Rate with Charge |
Point to Point
Annual
|
185%
Participation
|
| 1-Year S&P 500 LV DRC 5% ER PTP Participation Rate |
Point to Point
Annual
|
150%
Participation
|
| 2-Year Loomis Sayles Managed Futures 2 PTP Participation Rate with Charge |
Point to Point
Biennial
|
300%
Participation
|
| 2-Year Loomis Sayles Managed Futures 2 PTP Participation Rate |
Point to Point
Biennial
|
250%
Participation
|
| 2-Year S&P 500 LV DRC 5% ER PTP Participation Rate with Charge |
Point to Point
Biennial
|
255%
Participation
|
| 2-Year S&P 500 LV DRC 5% ER PTP Participation Rate |
Point to Point
Biennial
|
210%
Participation
|
| 3-Year Term S&P PRISM PTP Participation Rate with Charge |
Performance Ladder
Triennial
|
280%
Participation
|
| 5-Year Term S&P PRISM PTP Participation Rate |
Performance Ladder
5-Year
|
300%
Participation
|
| 4-Year Term S&P PRISM PTP Participation Rate |
Performance Ladder
4-Year
|
265%
Participation
|
| 3-Year Term S&P PRISM PTP Participation Rate |
Performance Ladder
Triennial
|
240%
Participation
|
| 2-Year Term S&P PRISM PTP Participation Rate |
Performance Ladder
Biennial
|
205%
Participation
|
| 1-Year Term S&P PRISM PTP Participation Rate |
Performance Ladder
Annual
|
150%
Participation
|
| 5-Year Term S&P PRISM PTP Participation Rate with Charge |
Performance Ladder
5-Year
|
340%
Participation
|
| 4-Year Term S&P PRISM PTP Participation Rate with Charge |
Performance Ladder
4-Year
|
305%
Participation
|
| 2-Year Term S&P PRISM PTP Participation Rate with Charge |
Performance Ladder
Biennial
|
245%
Participation
|
| 1-Year Term S&P PRISM PTP Participation Rate with Charge |
Performance Ladder
Annual
|
175%
Participation
|
| 1-Year Term Research Affiliates Global Multi-Asset PTP Participation Rate |
Performance Ladder
Annual
|
175%
Participation
|
| 2-Year Term Research Affiliates Global Multi-Asset PTP Participation Rate |
Performance Ladder
Biennial
|
260%
Participation
|
| 3-Year Term Research Affiliates Global Multi-Asset PTP Participation Rate |
Performance Ladder
Triennial
|
270%
Participation
|
| 4-Year Term Research Affiliates Global Multi-Asset PTP Participation Rate |
Performance Ladder
4-Year
|
295%
Participation
|
| 5-Year Term Research Affiliates Global Multi-Asset PTP Participation Rate |
Performance Ladder
5-Year
|
360%
Participation
|
| 1-Year Term Research Affiliates Global Multi-Asset PTP Participation Rate with Charge |
Performance Ladder
Annual
|
215%
Participation
|
| 2-Year Term Research Affiliates Global Multi-Asset PTP Participation Rate with Charge |
Performance Ladder
Biennial
|
305%
Participation
|
| 3-Year Term Research Affiliates Global Multi-Asset PTP Participation Rate with Charge |
Performance Ladder
Triennial
|
310%
Participation
|
| 4-Year Term Research Affiliates Global Multi-Asset PTP Participation Rate with Charge |
Performance Ladder
4-Year
|
345%
Participation
|
| 5-Year Term Research Affiliates Global Multi-Asset PTP Participation Rate with Charge |
Performance Ladder
5-Year
|
410%
Participation
|
| 1-Year Research Affiliates Global Multi-Asset PTP Participation Rate with Charge |
Point to Point
Annual
|
215%
Participation
|
| 2-Year Research Affiliates Global Multi-Asset PTP Participation Rate |
Point to Point
Biennial
|
260%
Participation
|
| 2-Year Research Affiliates Global Multi-Asset PTP Participation Rate with Charge |
Point to Point
Biennial
|
305%
Participation
|
| 2-Year S&P PRISM PTP Participation Rate with Charge |
Point to Point
Biennial
|
245%
Participation
|
| 1-Year Research Affiliates Global Multi-Asset PTP Participation Rate |
Point to Point
Annual
|
175%
Participation
|
| 1-Year S&P PRISM PTP Participation Rate with Charge |
Point to Point
Annual
|
175%
Participation
|
| 1-Year S&P PRISM PTP Participation Rate |
Point to Point
Annual
|
150%
Participation
|
| 2-Year S&P PRISM PTP Participation Rate |
Point to Point
Biennial
|
205%
Participation
|
| 4-Year Term NYSE GEARS PTP Participation Rate |
Performance Ladder
4-Year
|
200%
Participation
|
| 5-Year Term NYSE GEARS PTP Participation Rate |
Performance Ladder
5-Year
|
215%
Participation
|
| 1-Year Term Loomis Sayles Managed Futures 2 PTP Participation Rate |
Performance Ladder
Annual
|
180%
Participation
|
| 5-Year Term Loomis Sayles Managed Futures 2 PTP Participation Rate with Charge |
Performance Ladder
5-Year
|
485%
Participation
|
| 1-Year Term Loomis Sayles Managed Futures 2 PTP Participation Rate with Charge |
Performance Ladder
Annual
|
220%
Participation
|
| 2-Year Term Loomis Sayles Managed Futures 2 PTP Participation Rate with Charge |
Performance Ladder
Biennial
|
300%
Participation
|
| 3-Year Term Loomis Sayles Managed Futures 2 PTP Participation Rate with Charge |
Performance Ladder
Triennial
|
390%
Participation
|
| 4-Year Term Loomis Sayles Managed Futures 2 PTP Participation Rate with Charge |
Performance Ladder
4-Year
|
440%
Participation
|
| 5-Year Term Loomis Sayles Managed Futures 2 PTP Participation Rate |
Performance Ladder
5-Year
|
435%
Participation
|
| 4-Year Term Loomis Sayles Managed Futures 2 PTP Participation Rate |
Performance Ladder
4-Year
|
365%
Participation
|
| 3-Year Term Loomis Sayles Managed Futures 2 PTP Participation Rate |
Performance Ladder
Triennial
|
320%
Participation
|
| 2-Year Term Loomis Sayles Managed Futures 2 PTP Participation Rate |
Performance Ladder
Biennial
|
250%
Participation
|
| 1-Year Term NYSE GEARS PTP Participation Rate with Charge |
Performance Ladder
Annual
|
115%
Participation
|
| 2-Year Term NYSE GEARS PTP Participation Rate with Charge |
Performance Ladder
Biennial
|
175%
Participation
|
| 3-Year Term NYSE GEARS PTP Participation Rate with Charge |
Performance Ladder
Triennial
|
205%
Participation
|
| 4-Year Term NYSE GEARS PTP Participation Rate with Charge |
Performance Ladder
4-Year
|
240%
Participation
|
| 5-Year Term NYSE GEARS PTP Participation Rate with Charge |
Performance Ladder
5-Year
|
260%
Participation
|
| 1-Year Term NYSE GEARS PTP Participation Rate |
Performance Ladder
Annual
|
100%
Participation
|
| 2-Year Term NYSE GEARS PTP Participation Rate |
Performance Ladder
Biennial
|
140%
Participation
|
| 3-Year Term NYSE GEARS PTP Participation Rate |
Performance Ladder
Triennial
|
170%
Participation
|
| 1-Year Loomis Sayles Managed Futures PTP Participation Rate (OR Only) |
Point to Point
Annual
|
180%
Participation
|
| 1-Year Loomis Sayles Managed Futures PTP Participation Rate (OR Only) with Charge |
Point to Point
Annual
|
220%
Participation
|
| 2-Year NYSE GEARS PTP Participation Rate |
Point to Point
Biennial
|
140%
Participation
|
| 2-Year NYSE GEARS PTP Participation Rate with Charge |
Point to Point
Biennial
|
175%
Participation
|
| 1-Year NYSE GEARS PTP Participation Rate |
Point to Point
Annual
|
100%
Participation
|
| 1-Year NYSE GEARS PTP Participation Rate with Charge |
Point to Point
Annual
|
115%
Participation
|
| 2-Year Loomis Sayles Managed Futures PTP Participation Rate (OR Only) with Charge |
Point to Point
Biennial
|
300%
Participation
|
| 2-Year Loomis Sayles Managed Futures PTP Participation Rate (OR Only) |
Point to Point
Biennial
|
250%
Participation
|
| 2-Year Term S&P 500 Distance Stabilizer PTP Participation Rate |
Performance Ladder
Biennial
|
110%
Participation
|
| 1-Year Term S&P 500 Distance Stabilizer PTP Participation Rate |
Performance Ladder
Annual
|
80%
Participation
|
| 5-Year Term S&P 500 Distance Stabilizer PTP Participation Rate with Charge |
Performance Ladder
5-Year
|
190%
Participation
|
| 4-Year Term S&P 500 Distance Stabilizer PTP Participation Rate with Charge |
Performance Ladder
4-Year
|
165%
Participation
|
| 3-Year Term S&P 500 Distance Stabilizer PTP Participation Rate with Charge |
Performance Ladder
Triennial
|
145%
Participation
|
| 2-Year Term S&P 500 Distance Stabilizer PTP Participation Rate with Charge |
Performance Ladder
Biennial
|
130%
Participation
|
| 1-Year Term S&P 500 Distance Stabilizer PTP Participation Rate with Charge |
Performance Ladder
Annual
|
90%
Participation
|
| 4-Year Term S&P 500 Distance Stabilizer PTP Participation Rate |
Performance Ladder
4-Year
|
130%
Participation
|
| 3-Year Term S&P 500 Distance Stabilizer PTP Participation Rate |
Performance Ladder
Triennial
|
120%
Participation
|
| 5-Year Term S&P 500 Distance Stabilizer PTP Participation Rate |
Performance Ladder
5-Year
|
150%
Participation
|
| 2-Year S&P 500 Distance Stabilizer PTP Participation Rate |
Point to Point
Biennial
|
110%
Participation
|
| 1-Year S&P 500 Distance Stabilizer PTP Participation Rate |
Point to Point
Annual
|
80%
Participation
|
| 1-Year S&P 500 Distance Stabilizer PTP Participation Rate with Charge |
Point to Point
Annual
|
90%
Participation
|
| 2-Year S&P 500 Distance Stabilizer PTP Participation Rate with Charge |
Point to Point
Biennial
|
130%
Participation
|
| 1-Year S&P 500 PTP Cap |
Point to Point
Annual
|
8.5%
Cap
|
Surrender schedule
| Year | 1 | 2 | 3 | 4 | 5 | 6 | 7 | 8 | 9 | 10 |
|---|---|---|---|---|---|---|---|---|---|---|
| Penalty | 10% | 10% | 10% | 10% | 10% | 9% | 8% | 7% | 6% | 4% |
Riders
No Riders for NAC Secure Horizon annuity.
Waivers
Nursing Home
Unavailable in states: CA, and SD
After your first contract year, if you become confined to a qualified nursing care facility for at least 90 consecutive days, you can withdraw 100% of your accumulation value without a surrender charge and without application of a market value adjustment. You cannot be confined at the time your contract is issued. This rider is automatically included with your annuity at no additional charge. The nursing home waiver does not include home health care.
RMD
Any portion of the Required Minimum Distribution exceeding the 7% penalty-free withdrawal amount is available without surrender charges or market value adjustments, based on current company practice.
Withdrawal Provisions
Penalty-free withdrawals Beginning in the 2nd Contract Year, you may take a penalty-free withdrawal (also known as a penalty-free partial surrender) without surrender charges or market value adjustment, of up to 7% of your beginning of year Accumulation Value. On Required Minimum Distributions (RMDs) exceeding the available penalty-free allowance, surrender charges and market value adjustments will be waived by current company practice.
- A.M. Best A+
- Fitch A+
- S&P A+
- Comdex 89
Other North American Products
Similar Products